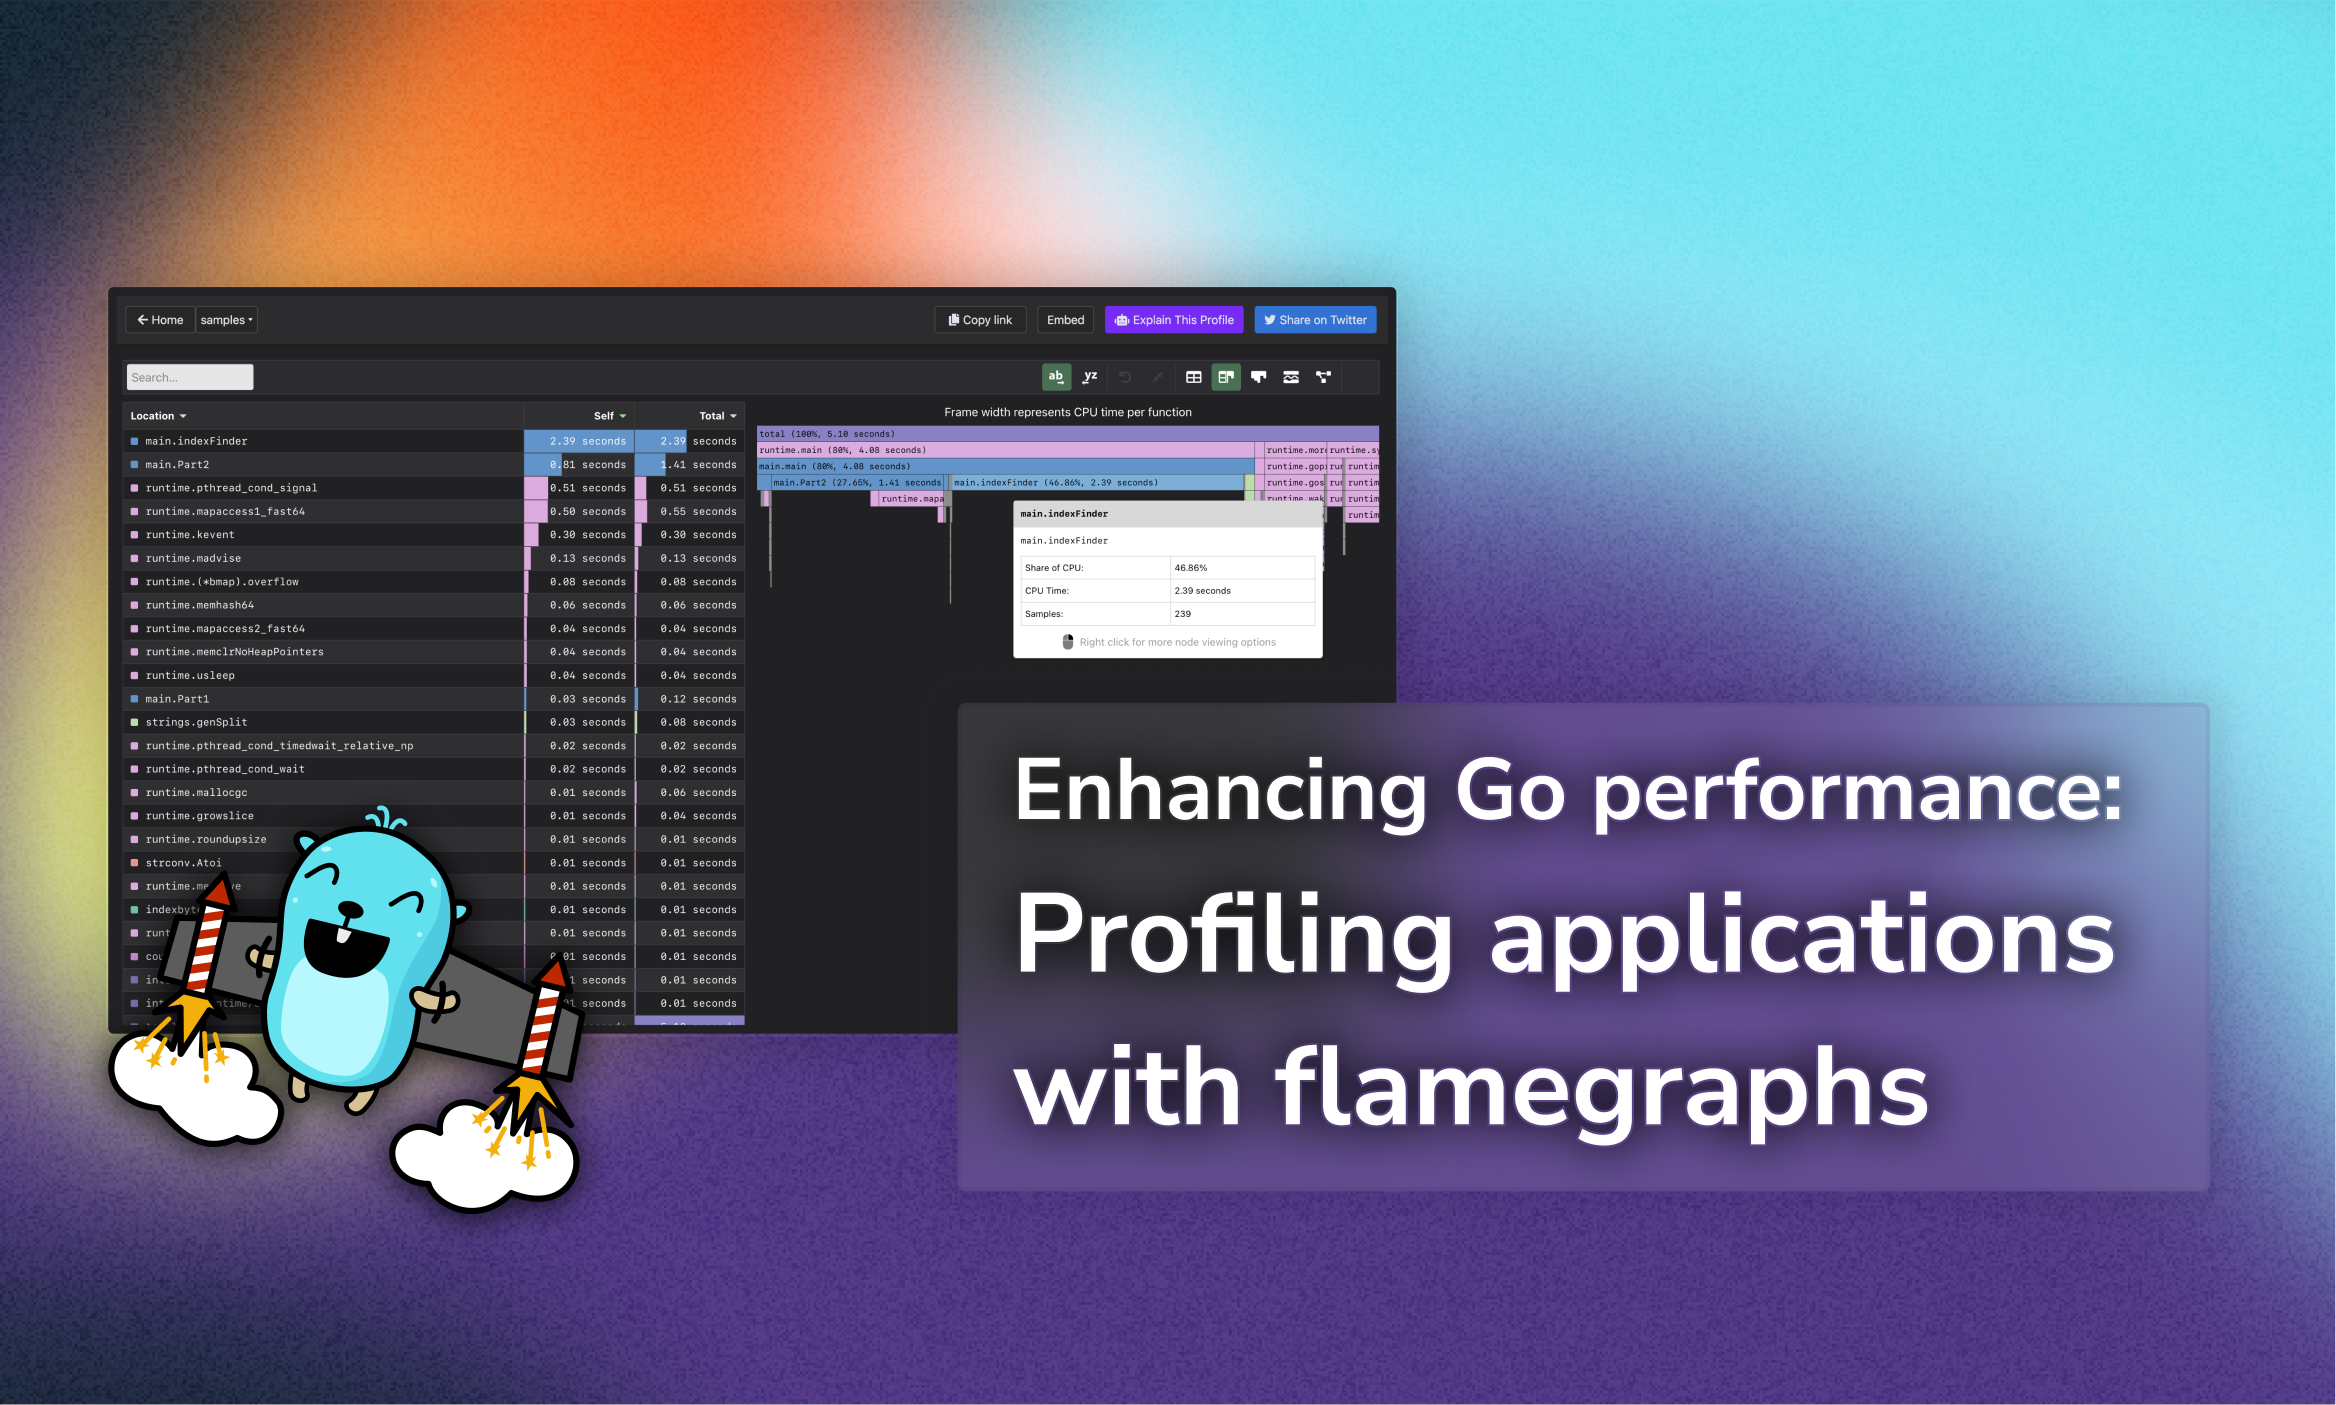
Enhancing Go performance: Profiling applications with flamegraphs
Table of Contents
Profiling is an essential practice for optimizing the performance of your Go applications. While many tutorials focus on profiling HTTP servers, it’s equally important to understand how to profile non-server Go programs. In this guide, we’ll explore how to set up profiling in your Go application, visualize the results using various tools, and address common challenges you might encounter.
Setting Up Profiling in Your Go Application
To begin profiling your Go application, you’ll need to integrate CPU profiling into your code. This involves importing the necessary packages and adding specific functions to start and stop the profiler.
1. Import Necessary Packages
Ensure that your main package imports the following:
import (
    "os"
    "runtime/pprof"
)
2. Insert Profiling Code
Within your main function, add the following code to create a profile file and start the CPU profiler:
func main() {
    f, err := os.Create("cpu.pprof")
    if err != nil {
        panic(err)
    }
    pprof.StartCPUProfile(f)
    defer pprof.StopCPUProfile()

    // Your application code here
}
This setup will generate a cpu.pprof file containing the profiling data when you run your application.
3. Build and Run Your Application
Compile your Go application and execute the binary:
go build -o slow_app
./slow_app
After running your application, the cpu.pprof file will be created in the current directory.
Visualizing Profiling Data
Interpreting raw profiling data can be challenging. Visualization tools like pprof’s web interface, Flamegraph.com (by Grafana ❤️), and Speedscope.app can help you understand the performance characteristics of your application.
If you want to get into performance and flamegraphs, I highly recommend you to check Aleksandra Sikora’s video presentation at BeJS.
1. Using pprof’s Web Interface
Go’s pprof tool provides a built-in web interface for visualizing profiling data:
go tool pprof -http=":8000" ./slow_app ./cpu.pprof
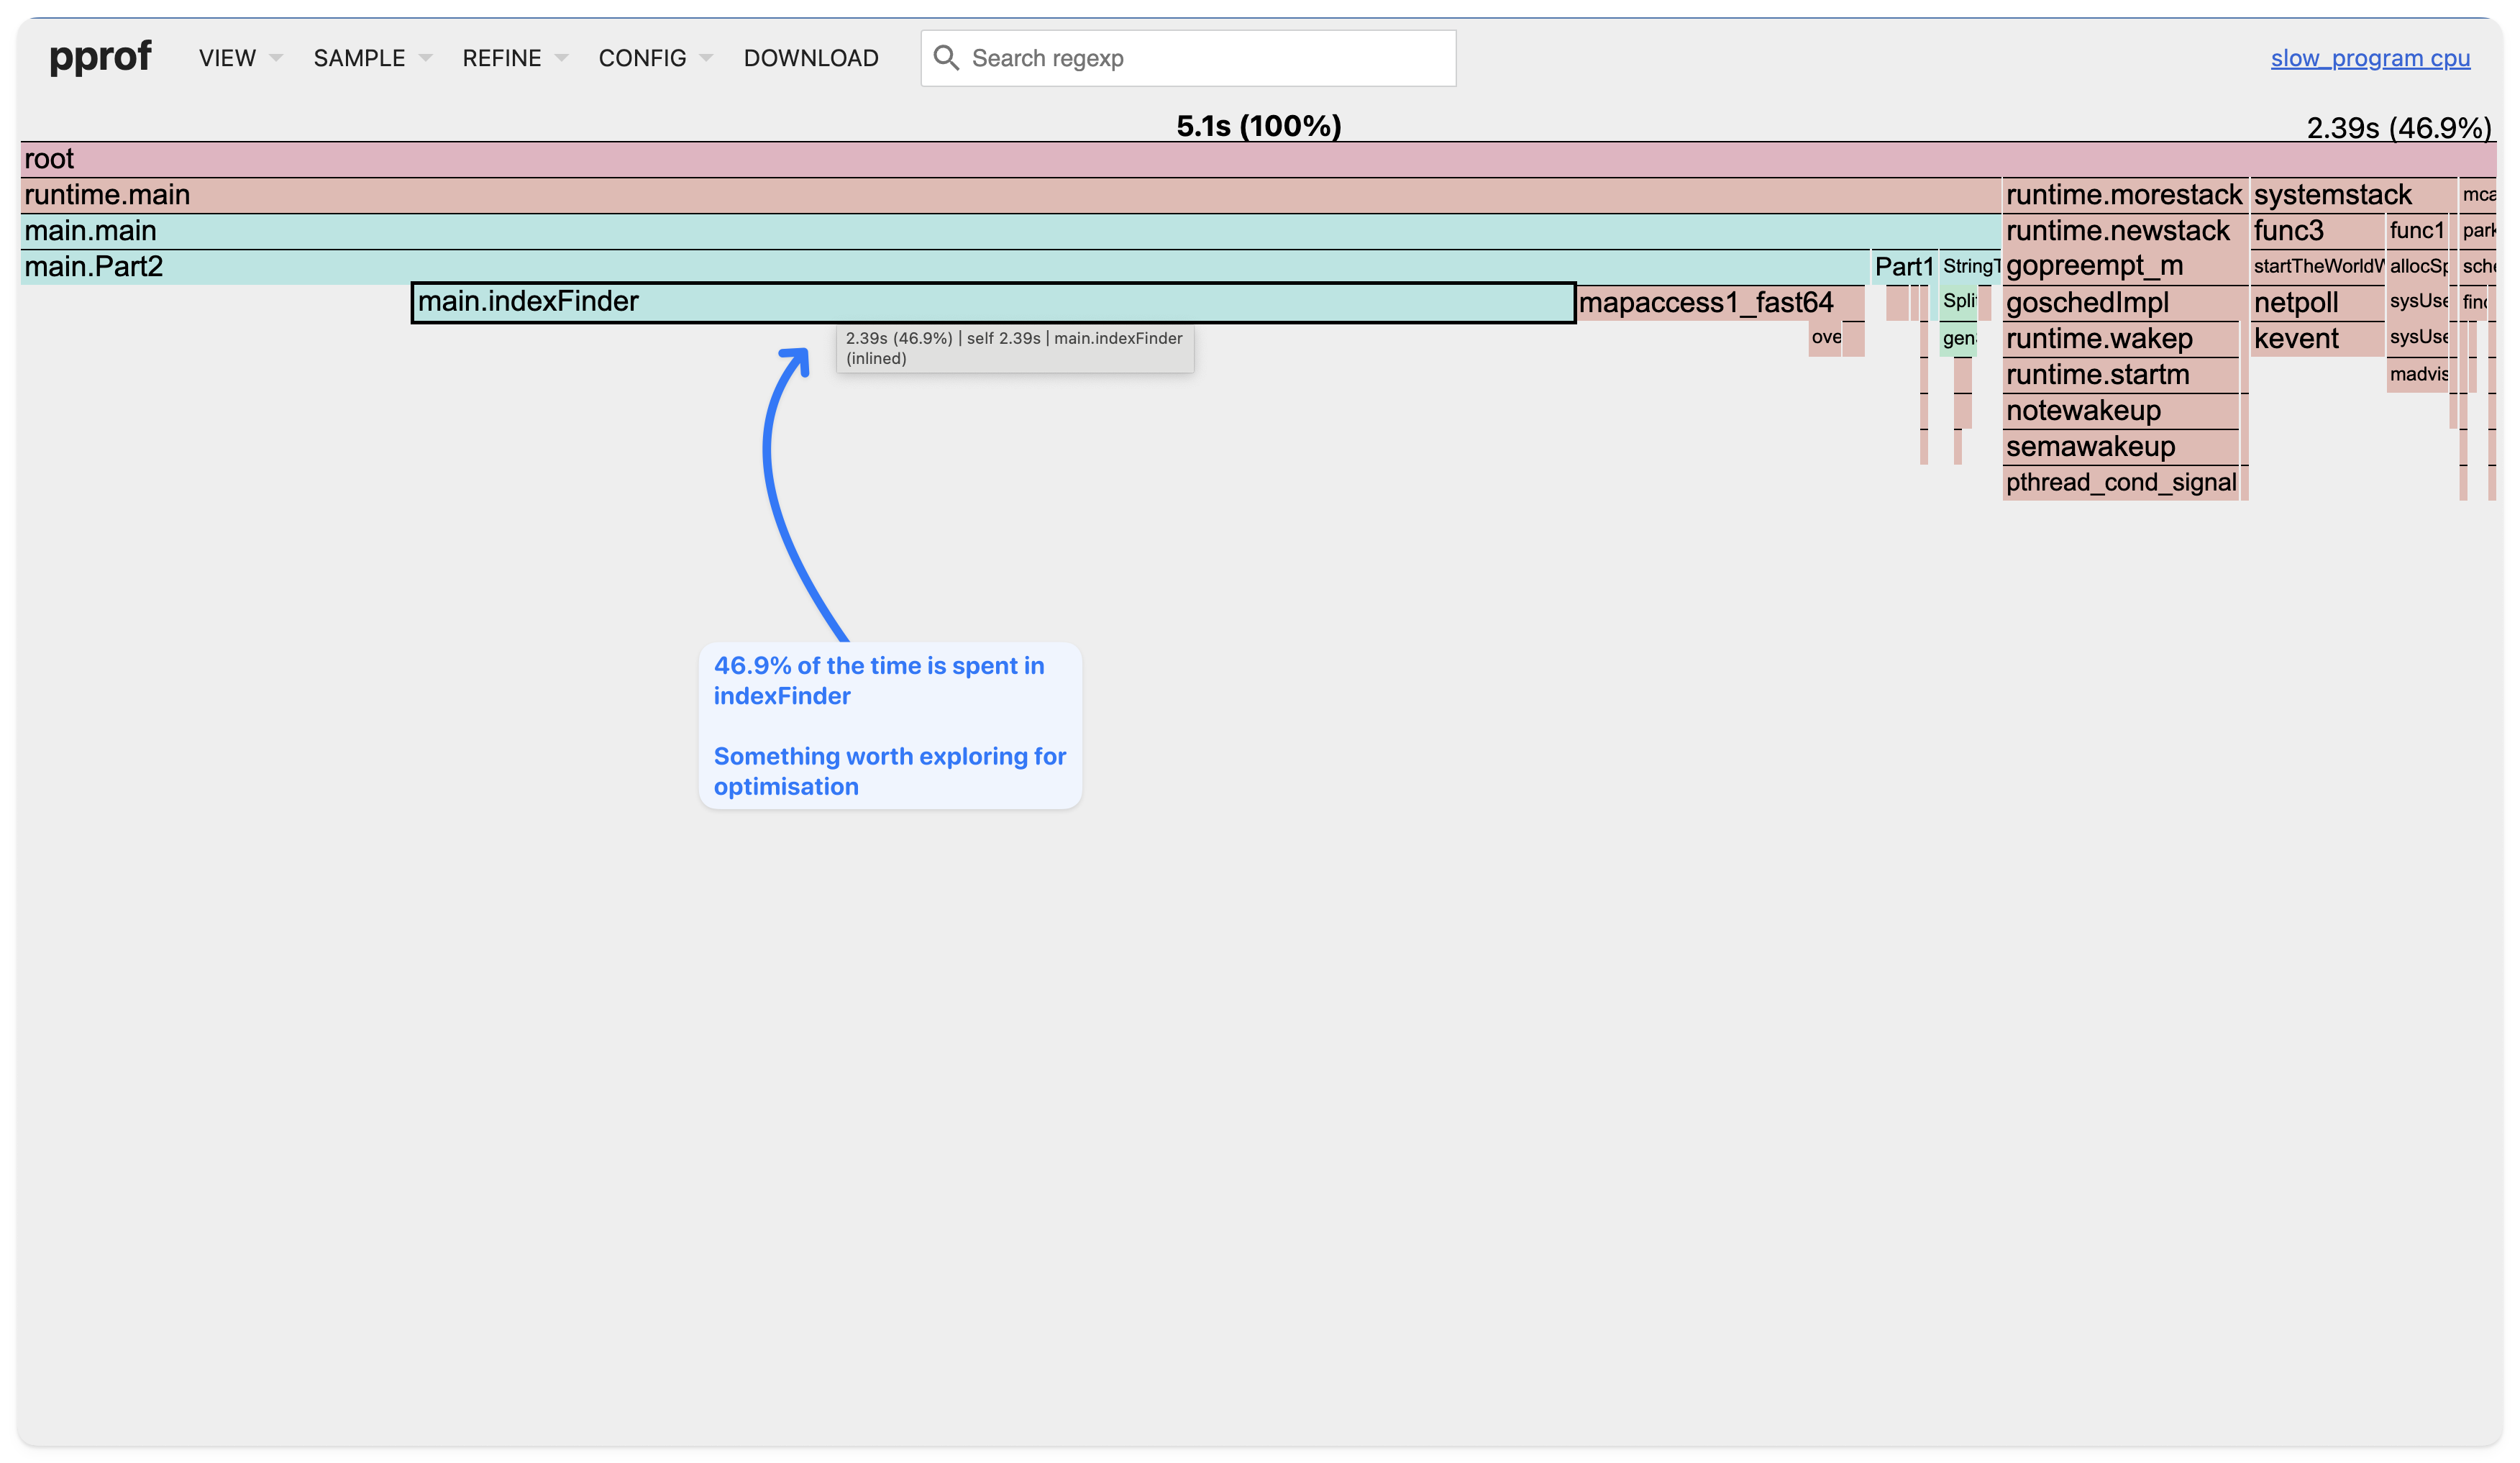
This command starts a local web server at port 8000. Navigate to http://localhost:8000 in your browser to explore various views, including flame graphs, which display function call hierarchies and their CPU usage.
2. Using Flamegraph.com
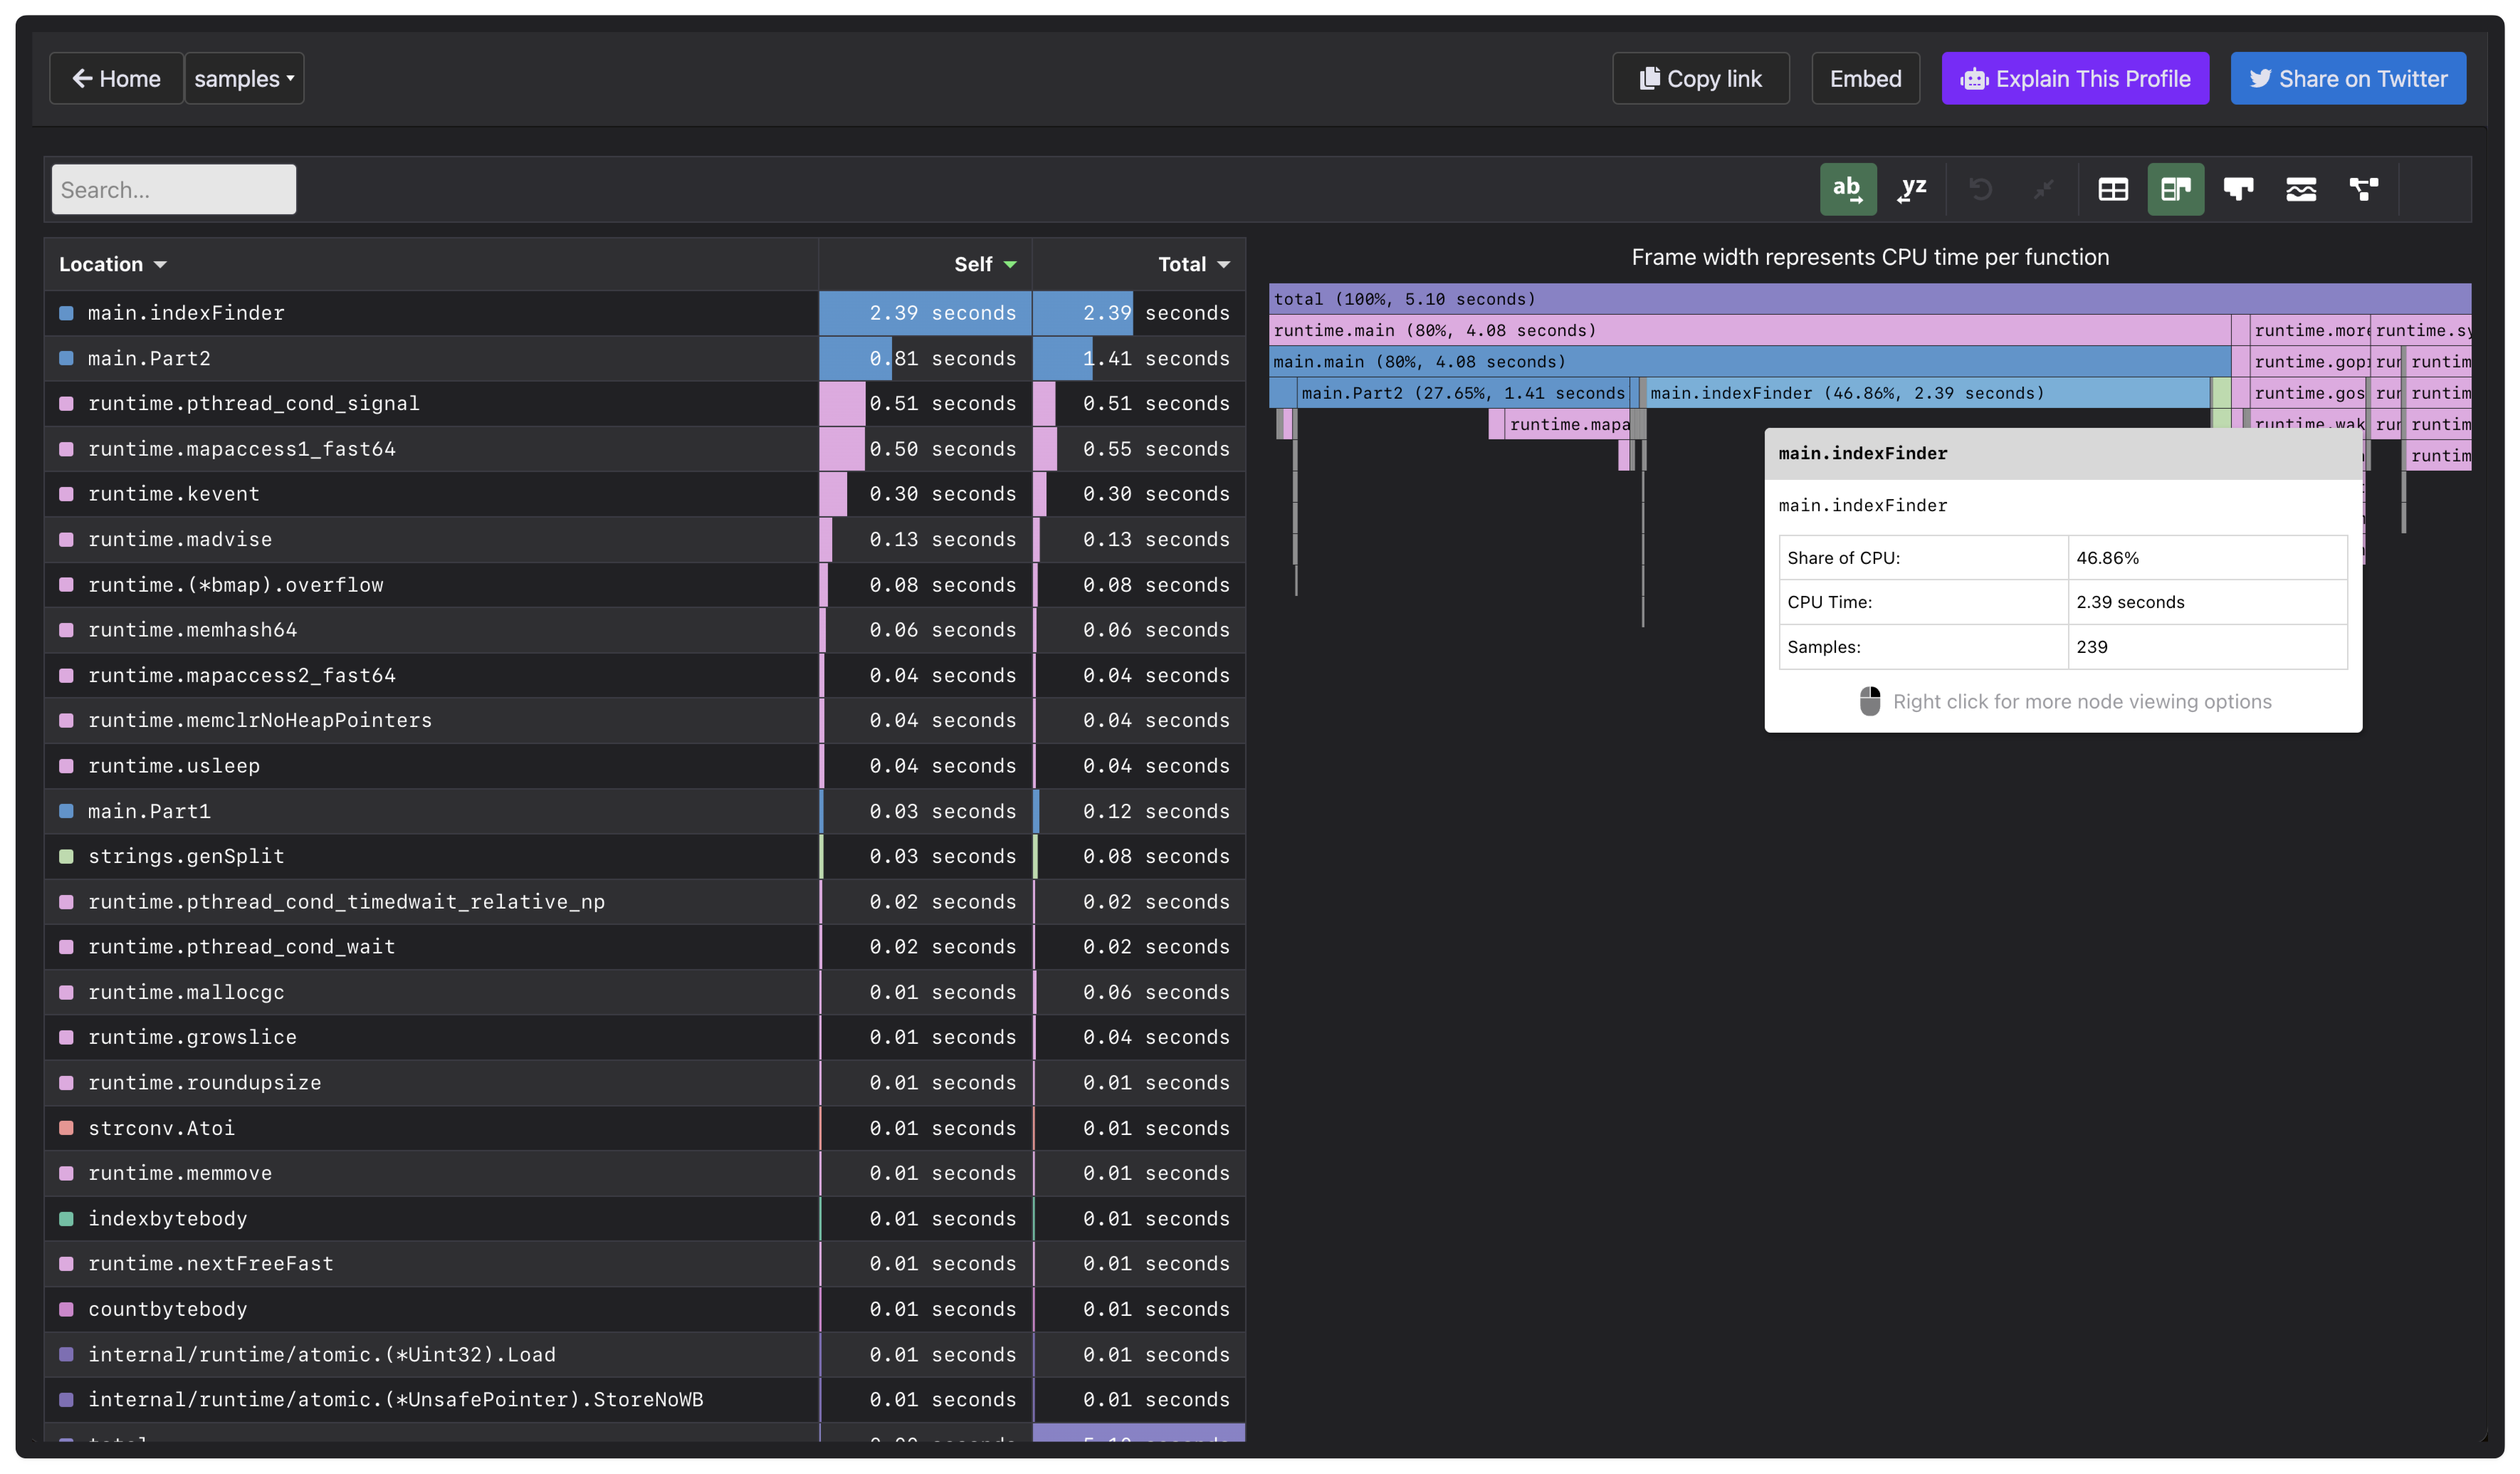
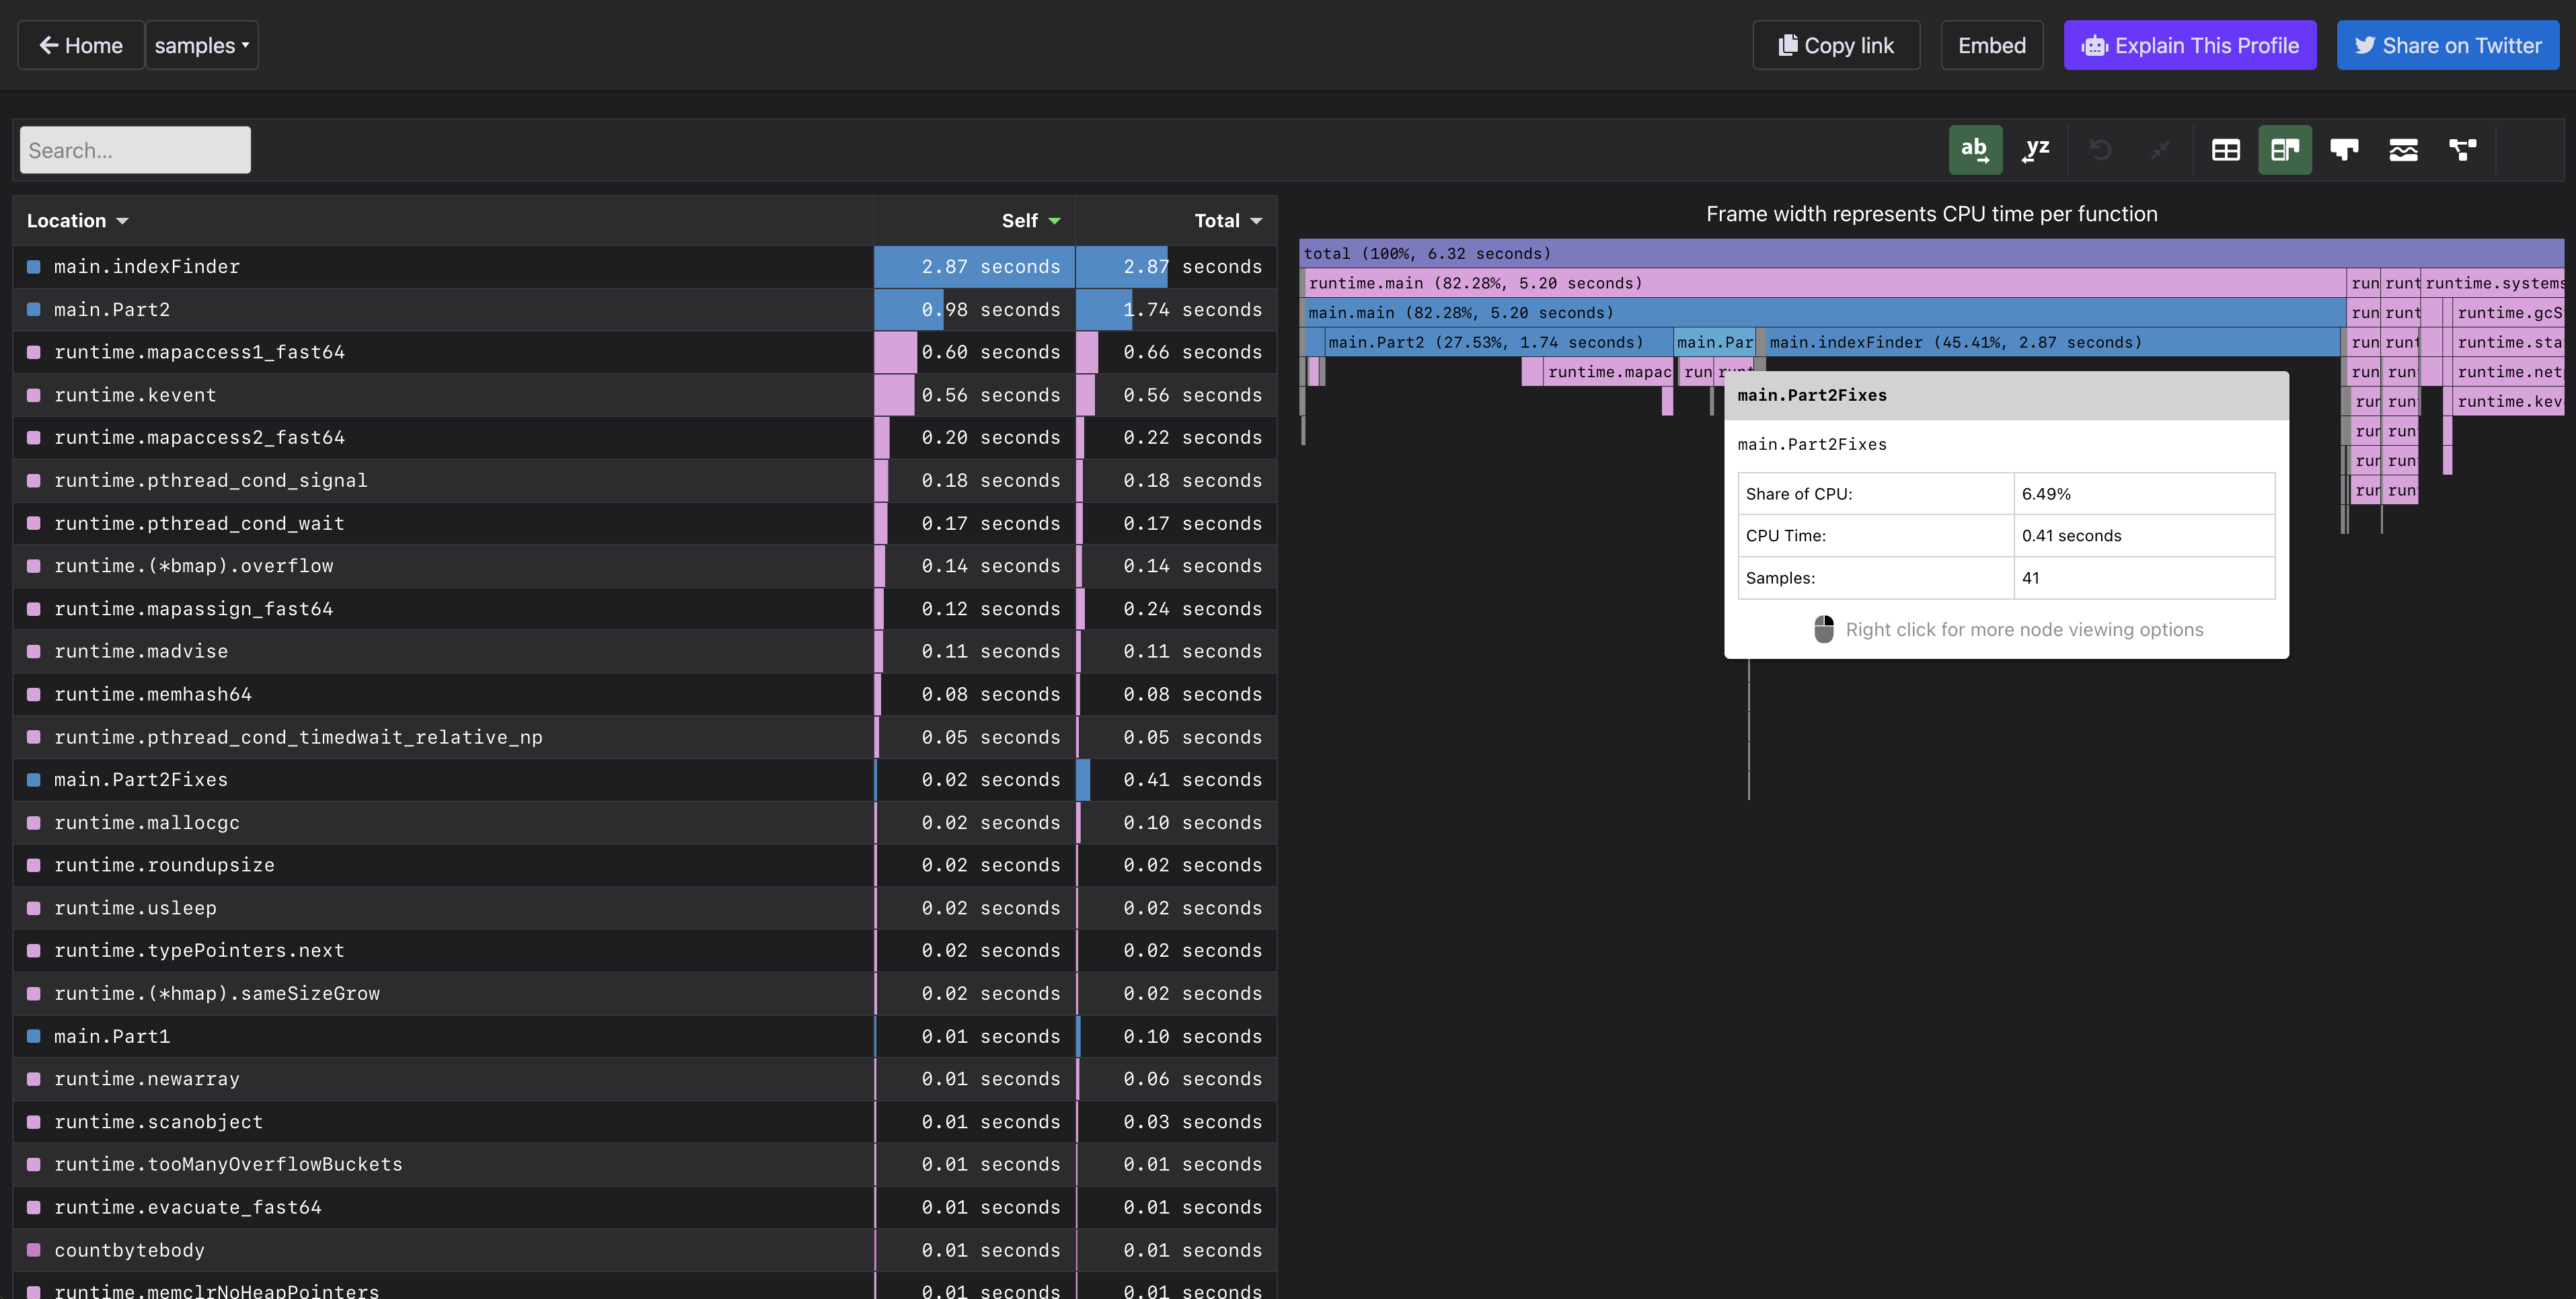
For a more interactive experience, you can use Flamegraph.com , developed by Grafana Labs. This tool allows you to upload your profiling data and interactively explore the flame graph to identify performance bottlenecks.
3. Using Speedscope.app
Another tool is Speedscope, which provides a responsive interface for analyzing large profiles. It supports various import formats, including pprof, making it versatile for different profiling needs.
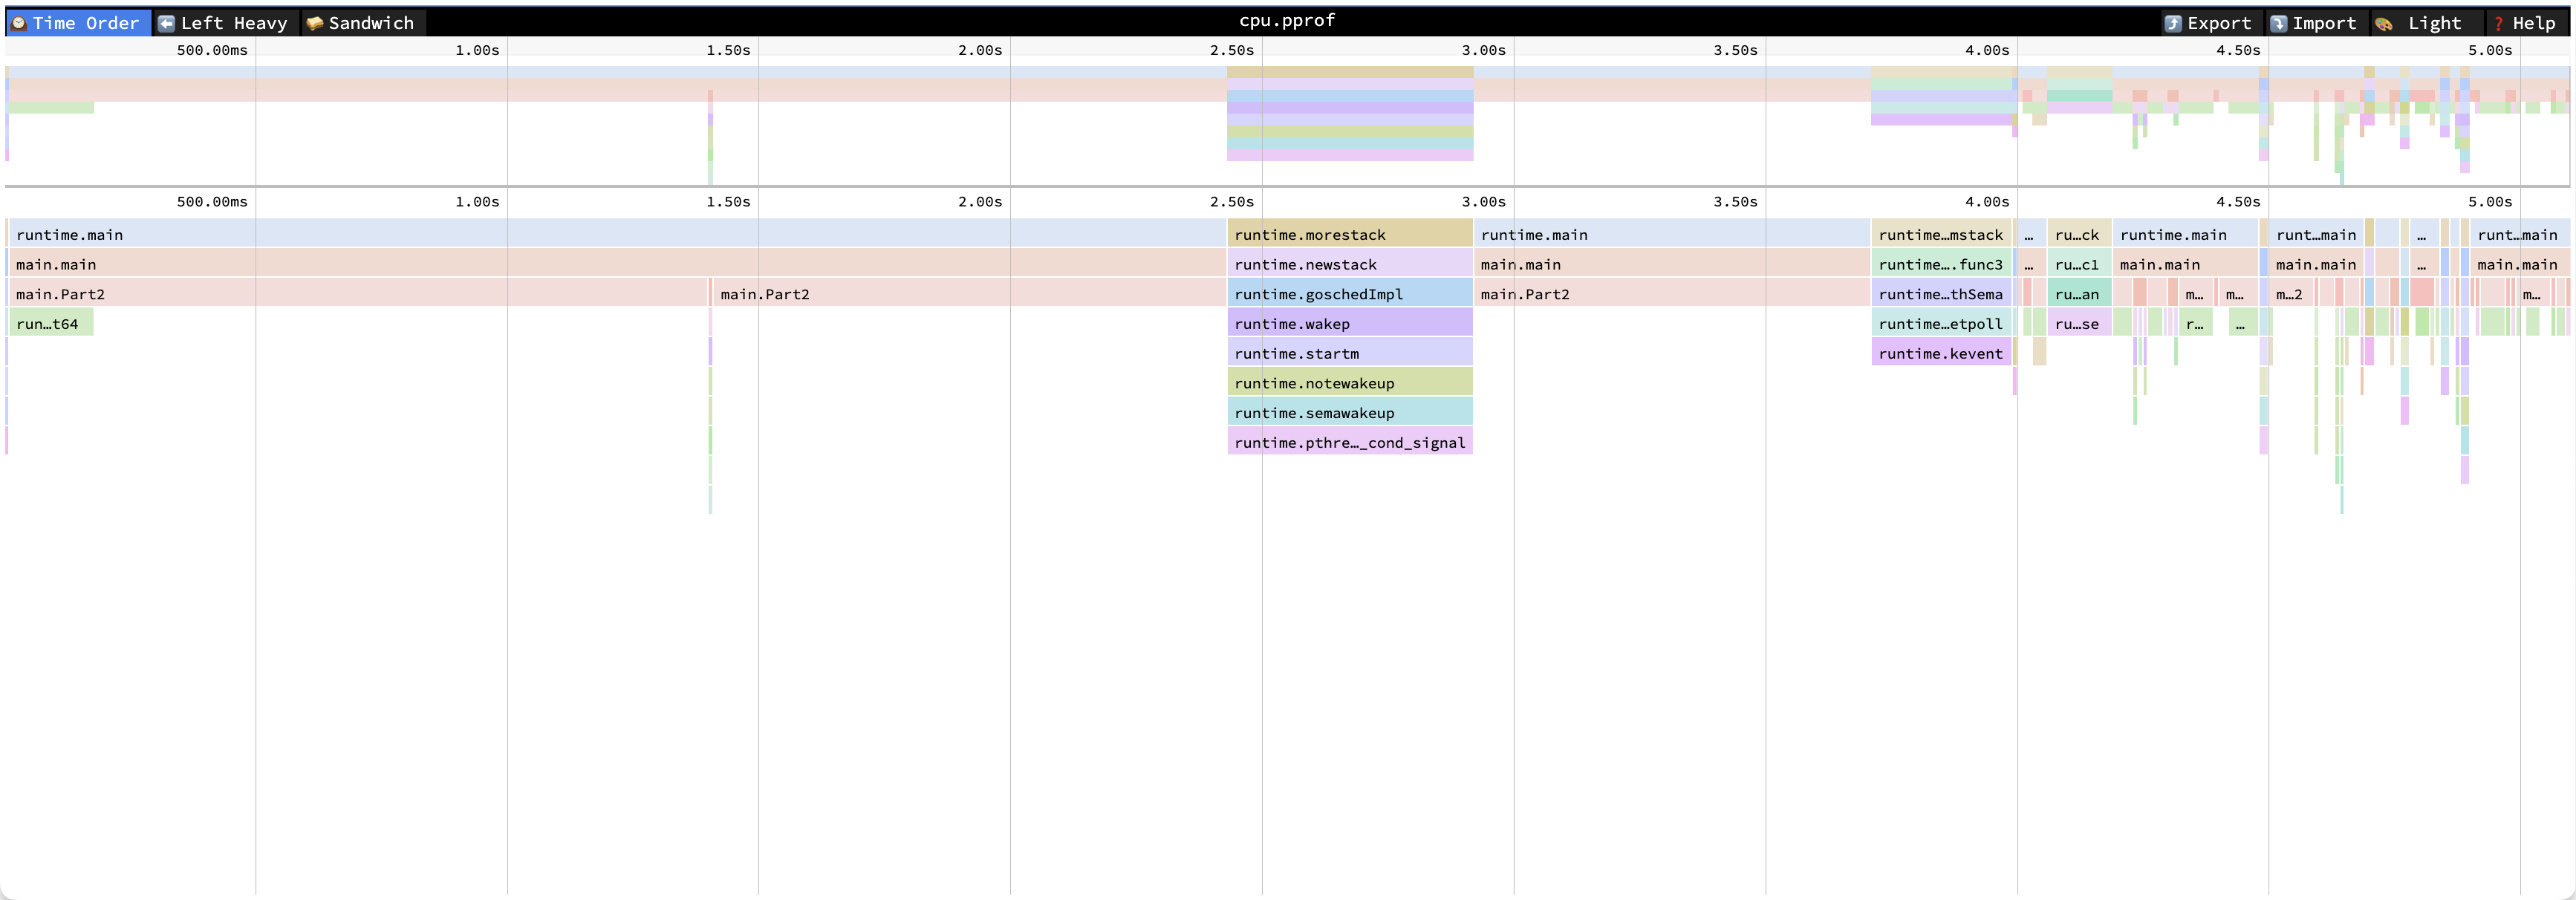
This was the least usable in my opinion, as besides the flamegraph, it doesn’t provide any other information. But even for the flamegraph,
I was unable to find the bottleneck (indexFind), as I could in the previous two tools.
Note: While Speedscope focuses only on flamegraphs, pprof’s and Flamegraph.com have a broader range of profiling views, including call graphs and top functions.
Identifying and Addressing Performance Bottlenecks
Once you’ve visualized your profiling data, you can identify functions that consume significant CPU time.
For example, if the flame graph indicates that a function like indexFinder is a bottleneck,
you can focus on optimizing its implementation or the way it’s utilized within your application.
Below I provide an example of a flamegraph that shows a new approach that did not use indexFinder function, and how it fixed the result.
It’s important to notice that
indexFindermight now be slow, rather than getting called many times in the previous implementation, thus accumulating CPU time (which was indeed the case).
Bonus: Graphs from pprof
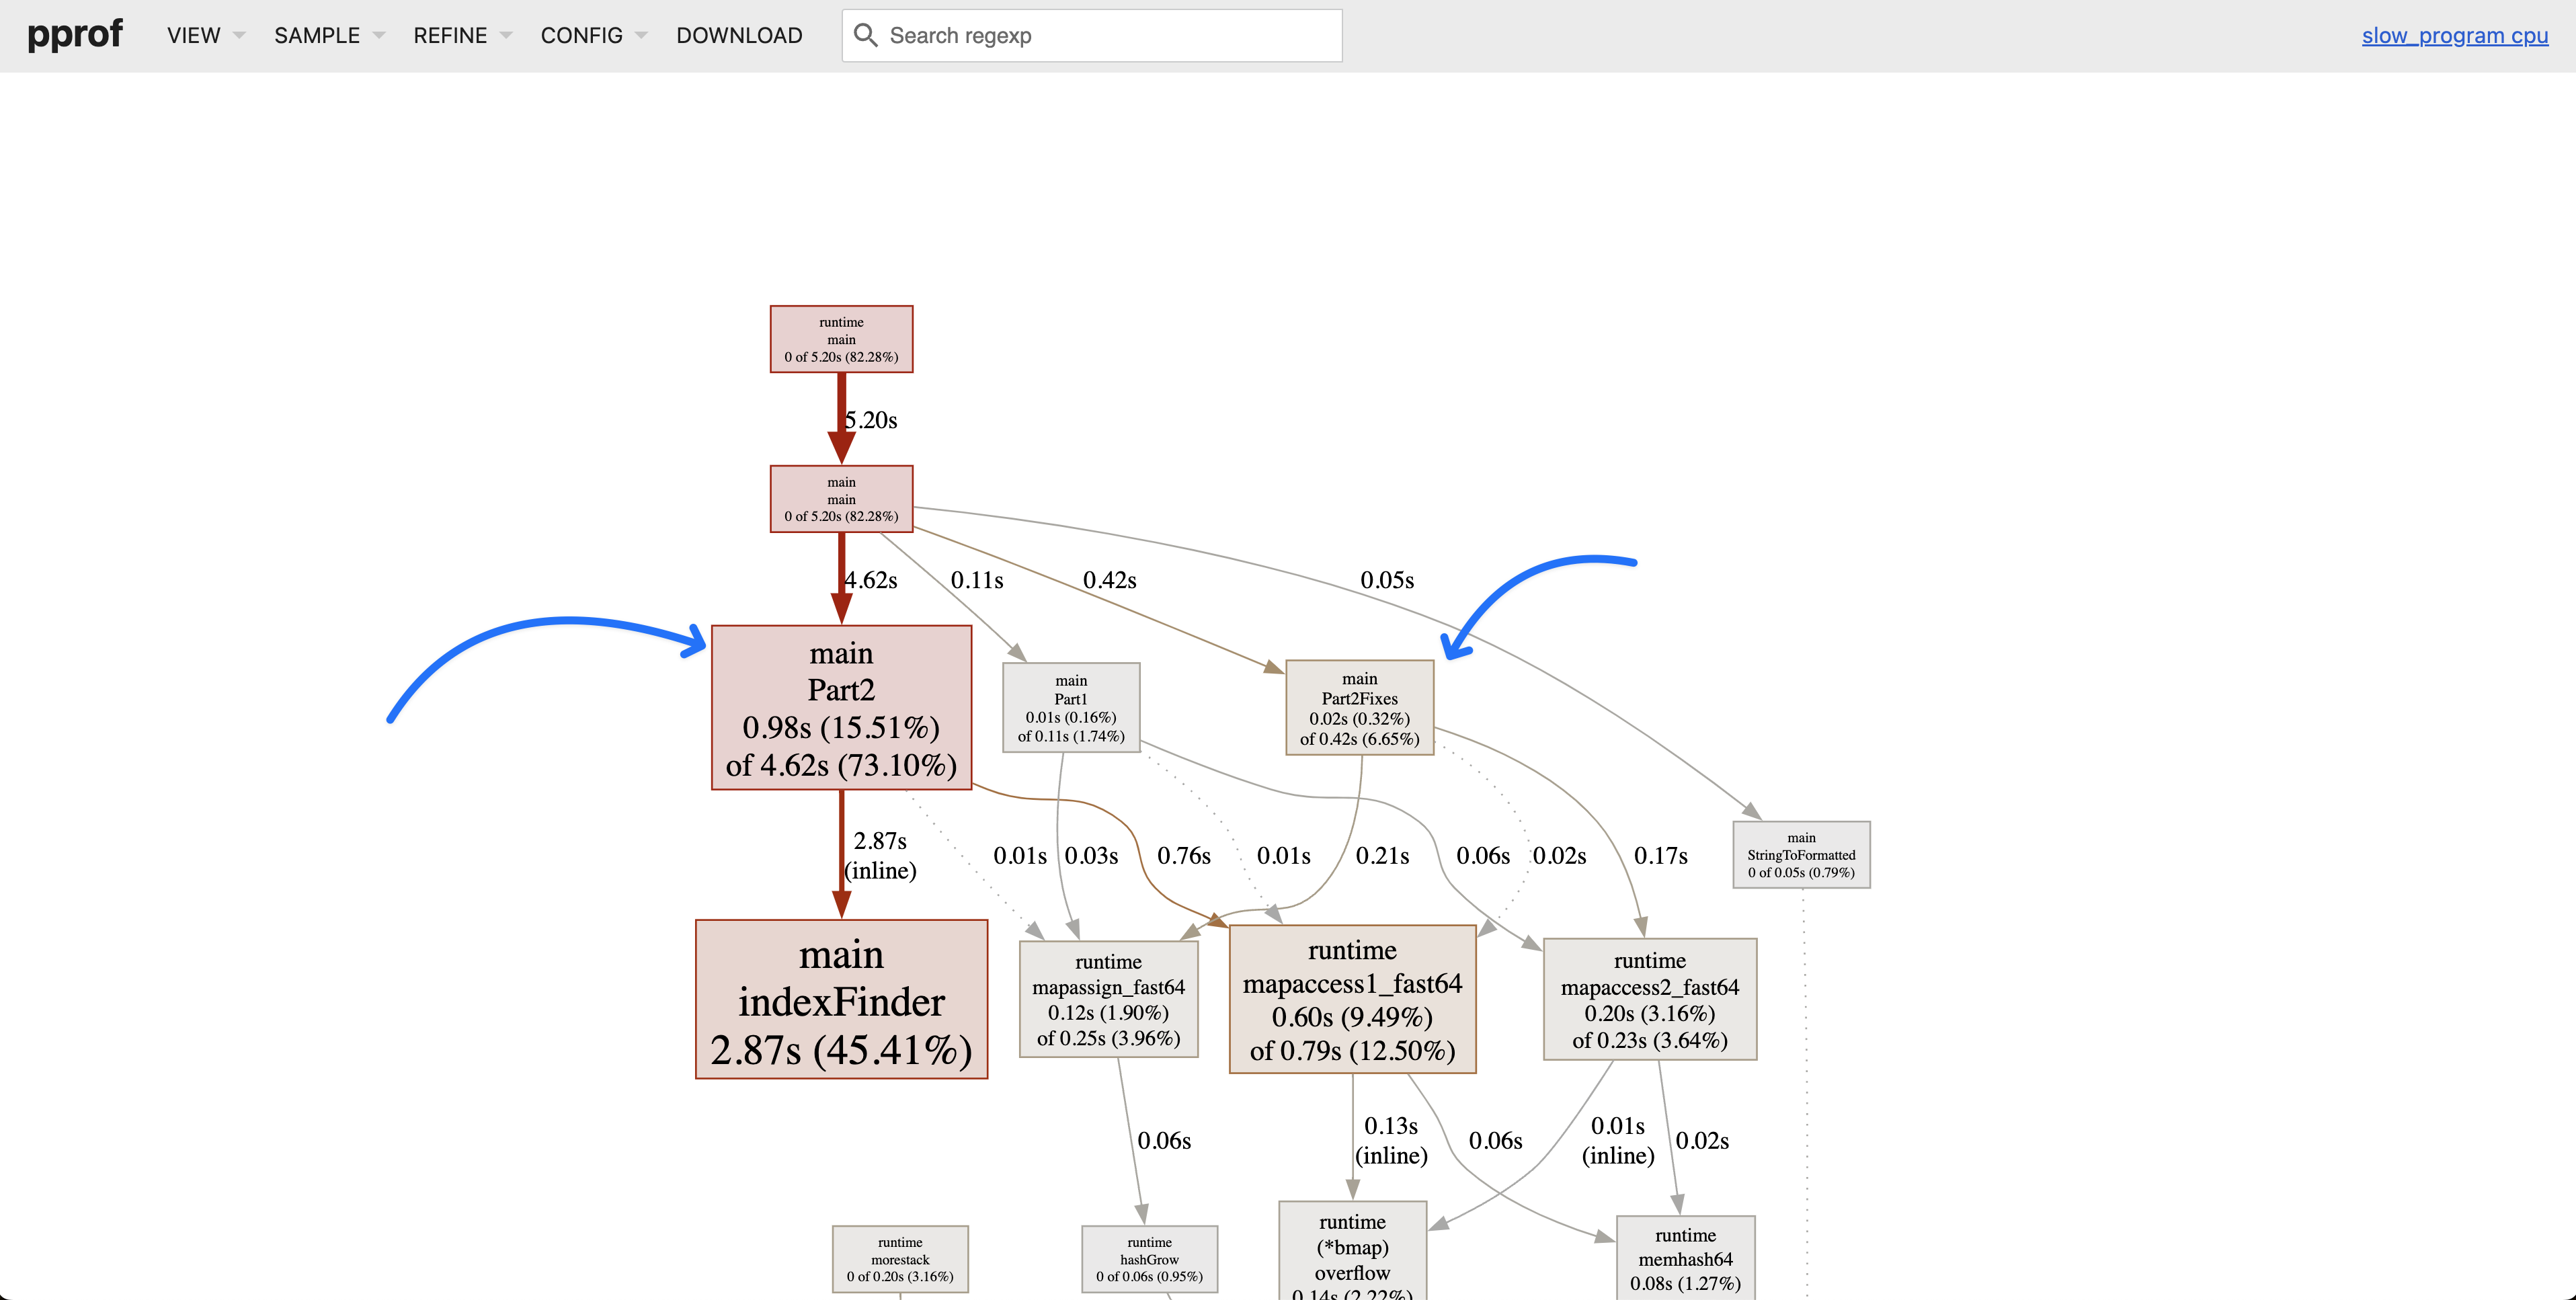
Another way to visualize the profiling data is by generating graphs using the go tool pprof command.
As previously, both Part2 and Part2Fixes are included in the graph, to show the difference between them.
It’s visible how much performance gain we got from the optimized version of the code, from 4.6s to 0.42s.
Caveats
Profiling very fast-executing code can result in insufficient sampling data, leading to incomplete flame graphs. To mitigate this, you can modify your code to run the critical section multiple times, ensuring the profiler collects adequate data:
func main() {
    f, err := os.Create("cpu.pprof")
    if err != nil {
        panic(err)
    }
    pprof.StartCPUProfile(f)
    defer pprof.StopCPUProfile()


    for i := 0; i < 1000; i++ {
    	// Multiple runs to collect sufficient data
     // Your application code here
    }
}

By looping the execution, you provide the profiler with more opportunities to sample the code, resulting in more comprehensive profiling data.
Conclusion
Profiling is a powerful technique for uncovering performance issues in your Go applications. By integrating profiling into your development process and utilizing visualization tools like pprof, Flamegraph.com, and Speedscope.app, you can gain valuable insights into your application’s behavior and make informed optimization decisions.
If you want to grab the code example you can find it here. This code was actually used to solve Part 2 of the Advent of Code 2024 (Day 5).
Happy profiling!